

Official statistics confirm that goods trade between the European Union and the United States reached a new record in 2025. The total value exceeded $1 trillion on the U.S. side and €910 billion on the EU side, even as tariff disputes created uncertainty throughout the year.
This outcome reflects strong underlying demand for each other’s products, combined with companies adjusting supply chains ahead of policy changes.
What Happened?
U.S. government data shows total goods trade with the EU hit approximately $1.045 trillion in 2025. American exports to the EU rose to $412.5 billion, while imports from the EU reached $632.9 billion. The U.S. goods trade deficit with the EU narrowed slightly to $220.3 billion compared with 2024.
From the EU perspective, official Eurostat figures report total goods trade surpassing €910 billion. EU exports to the United States totaled €554.6 billion, and imports from the United States came in at €356.2 billion, producing a goods surplus of about €198 billion for the EU.
More Read

Services trade between the two sides also set a record at roughly €865 billion. These numbers represent the highest annual levels ever recorded for this bilateral relationship.
Key Details
The growth occurred despite tariff tensions that began early in 2025. Companies on both sides moved shipments forward in the first quarter to avoid potential higher costs. This front-loading boosted early-year figures before volumes fluctuated later in the year.
More Read

Notable patterns include:
• Strong performance in pharmaceuticals and chemicals, particularly exports routed through Ireland.
• A decline in EU automotive exports to the United States of about 20 percent in some analyses.
• Increased U.S. energy and machinery shipments to Europe.
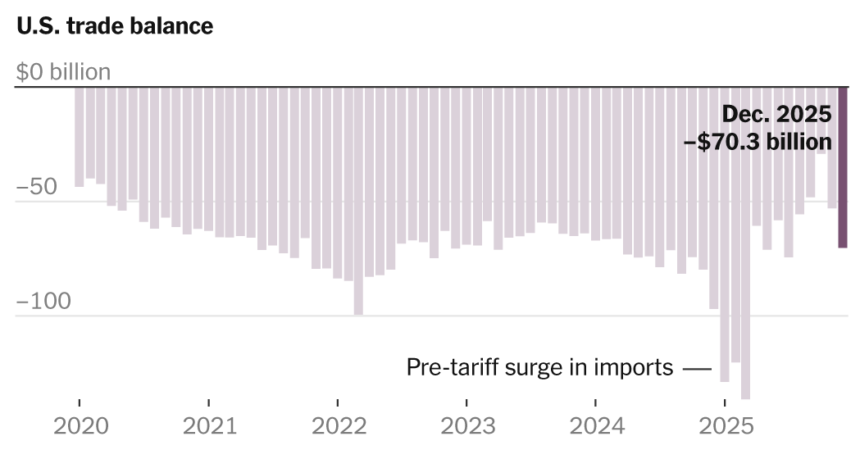
Monthly U.S. Census Bureau data revealed a peak import surge in March 2025, followed by more moderate flows through the rest of the year. Overall volume still climbed because baseline demand for medicines, aircraft parts, industrial equipment, and consumer goods remained high.
Why This Matters
More Read

The United States and European Union together account for nearly 30 percent of global goods and services trade and about 43 percent of world GDP. Their economies are deeply integrated through supply chains that support millions of jobs on both sides of the Atlantic.
For American consumers, higher EU imports often translate into greater availability and competitive pricing on items such as prescription drugs, vehicles, and machinery. For U.S. exporters, record sales to Europe support employment in pharmaceuticals, energy, aerospace, and advanced manufacturing.
A narrower U.S. goods deficit with the EU in 2025 signals modest progress on one measure of trade balance. However, the overall relationship remains complex because services trade runs in the opposite direction, with the United States running a surplus.
Businesses demonstrated resilience by rerouting some production and accelerating orders. This adaptability kept total trade volumes rising even when policy signals were mixed.
Background and Timeline
Transatlantic trade has grown steadily for decades. The United States and EU have long been each other’s top or second-largest goods trading partners. Pharmaceuticals, vehicles, machinery, and energy products dominate the exchange.
Key events in recent years:
• Pre-2025: Trade volumes expanded gradually, nearly doubling over the prior decade according to EU data.
• Early 2025: Tariff threats prompted companies to accelerate shipments, driving a sharp Q1 surge and a temporary peak in the EU goods surplus.
• Mid-2025: Volumes moderated after the initial rush, with some sectors such as autos facing pressure.
• August 21, 2025: The United States and European Union issued a Joint Statement outlining a framework for reciprocal, fair, and balanced trade. The EU committed to eliminating tariffs on U.S. industrial goods and offering preferential access for certain agricultural and seafood products. The United States agreed to apply a baseline of 15 percent or the most-favored-nation rate on most EU goods, with exceptions for items such as aircraft parts and generic pharmaceuticals.
• Late 2025 through 2026: Implementation steps followed, including EU regulations adopted in June 2026 that began reducing certain duties on U.S. goods.
These developments show how political negotiations and business decisions interact in real time.
What Officials and Data Sources Have Reported
The U.S. Census Bureau and the Office of the United States Trade Representative publish monthly and annual trade statistics. Their 2025 figures show clear year-over-year growth in both exports and imports with the EU, alongside a modestly improved deficit.
Eurostat, the EU’s statistical office, and the Council of the European Union confirm parallel records from the European side. Their data highlight the same broad trends while noting sector-specific shifts.
No single government statement claimed the record as a policy victory. Instead, the numbers emerged from routine statistical releases. Analysts at institutions such as the German Economic Institute have pointed out that headline totals can mask underlying pressures in specific industries, particularly automobiles.
Frequently Asked Questions
How much did EU-US goods trade total in 2025?
U.S. data show roughly $1.045 trillion. EU data show more than €910 billion. The two sets of figures use slightly different methodologies and exchange rates but both confirm a new record.
Did tariffs stop trade from growing?
No. Total volume increased despite tariff uncertainty. Companies adjusted timing and sourcing, especially in pharmaceuticals, which helped offset declines in other categories such as vehicles.
What products drove the record numbers?
Medicinal and pharmaceutical products ranked among the largest categories in both directions. Machinery, chemicals, and energy products also contributed significantly.
How does this affect everyday Americans?
Greater trade volume generally supports more choices and competitive prices for imported goods while sustaining export-related jobs in sectors such as energy and advanced manufacturing.
What comes next?
Parts of the August 2025 trade framework are being implemented through 2026 and beyond. Continued monitoring of monthly data will show whether the record pace continues or adjusts to the new tariff structure.
Conclusion
The 2025 record in EU-US goods trade demonstrates the depth of economic ties between two of the world’s largest economies. Even amid policy disagreements, companies found ways to maintain and expand commercial flows.
For American readers, the numbers underscore both opportunity and interdependence. Strong transatlantic trade supports jobs, supplies critical goods, and influences prices at home. Future stability will depend on how governments manage the tariff framework agreed in 2025 and how businesses continue to adapt.
Official data from the U.S. Census Bureau and Eurostat provide the clearest picture. These statistics offer a factual baseline for understanding one of the most important economic relationships in the world.